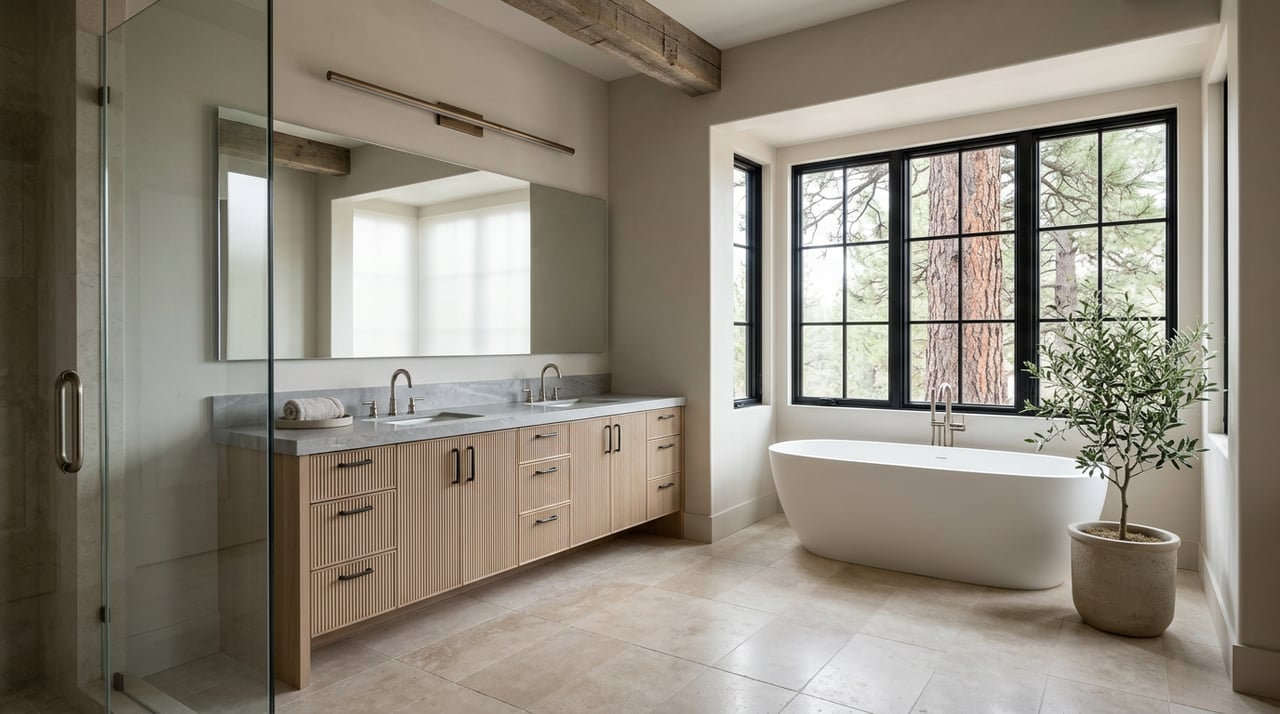
In Boulder, a 1974 Preservation Rule Is Still Deciding Which Neighborhoods Cool Off
September 17, 2026
September 17, 2026
A buyer looking at a listing on Mapleton Hill this year runs into a detail that never shows up in the photos. Before anyone can touch the front porch, swap a window, or add a dormer, the request goes to the City of Boulder's Landmarks Board. Simple repainting in an approved color might clear in days. Anything larger, an addition, a change to a street-facing wall, a full renovation, can take weeks or months of review under rules the city has enforced since 1974.
That single fact, easy to miss until you're under contract, turns out to explain something bigger than one neighborhood's paperwork. It's a big part of why Boulder's citywide price numbers and its neighborhood-level reality have started to disagree.
Anyone comparing Boulder data sources this year has probably noticed they don't quite agree. One widely used home value index put Boulder's average value at $957,377 as of late July 2026, down slightly, about 0.1 percent, from a year earlier. A separate tracking service, measuring median sale price over the three months ending in July 2026, put that figure at $981,000, up 9 percent year over year, with homes averaging 57 days on market compared to 50 the year before.
Those aren't contradictory measurements of the same thing. They're two different slices through a city where the underlying neighborhoods are moving in genuinely different directions. A citywide median blends historic, land-locked pockets where almost nothing new can be built with ordinary mid-century subdivisions where turnover is easier and price growth has to work harder to hold. Average the two together and you get a number that describes neither one well.
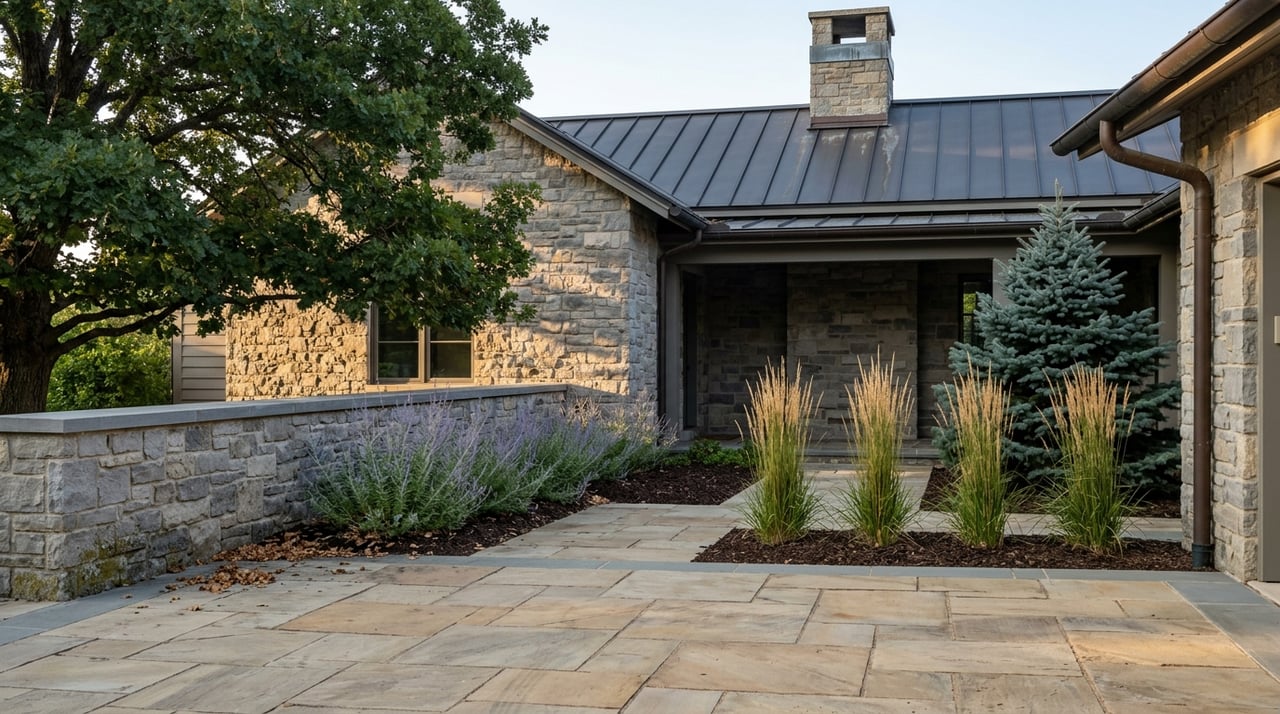
Mapleton Hill is the clearest example. It's one of ten historic districts in Boulder, home to more than 200 individually designated landmarks citywide, where any exterior change requires a Landmark Alteration Certificate before work begins. Homeowners have to preserve character-defining features like original windows and porch details, generally using period-appropriate materials. Even outside the formally designated districts, any Boulder building older than 50 years can trigger a separate historic preservation demolition review if a project would remove more than half the roof or any portion of a street-facing wall, including something as ordinary as enlarging a window opening or removing an enclosed porch.
The effect on supply is straightforward. It's slower and more expensive to substantially alter or replace a home in these areas, so fewer owners do it, and the housing stock stays roughly fixed while demand for that walkable, tree-lined, close-to-Pearl-Street character doesn't. Mapleton Hill's median sale price has been running around $1.45 million, well above Boulder's overall median, with homes typically moving in about 61 days. Chautauqua, hemmed in by open space at the base of the Flatirons and home to the Colorado Chautauqua, one of only 25 National Historic Landmarks in the state, shows a similar pattern: a median near $1.1 million with listings ranging from roughly $1 million to $3.8 million depending on lot and view.
Neither of these areas has room to add meaningfully more housing. That's not a policy opinion, it's a supply fact, and it's exactly the kind of constraint that keeps a submarket firm even while the citywide blended number looks flat or soft.
Table Mesa makes the point even more sharply, because the split shows up inside the neighborhood itself, not just between neighborhoods. Broader Table Mesa data for September 2026 showed the median list price at $1.09 million, down 12 percent from both the prior month and the prior year, with price per square foot also down double digits. Over a trailing 12-month window, a separate measure put the neighborhood's median sale price at $1,165,000, down 9 percent year over year.
At the same time, the specific pocket known as Table Mesa South, closer to the trailheads and open space, told a different story. Over the three months ending in May 2026, home prices there were up 25 percent year over year, with a median sale price of $1.2 million and homes selling in an average of 32 days, faster than the 38 days a year earlier.
Same zip code. Same shopping center. Same school boundaries. Genuinely different markets depending on whether the specific address backs to open space or sits a few streets back on an ordinary block. Martin Acres, just across Broadway from Table Mesa, functions as the release valve for the whole area: smaller mid-century ranches, an easier entry point into Boulder proper, and a market that behaves more like a typical suburban resale than a scarcity play.
Here's a quick way to see how differently these submarkets are behaving right now:
| Area | What's driving it | Recent price signal |
|---|---|---|
| Mapleton Hill | Historic district, Landmark Alteration Certificate required for exterior changes | Median around $1.45M, ~61 days on market |
| Chautauqua | Bounded by open space and the Flatirons, National Historic Landmark auditorium | Median around $1.1M, range roughly $1M to $3.8M |
| Table Mesa South (trailhead-adjacent) | Direct open space access, limited comparable inventory | Up 25% YoY (3 mo. ending May 2026), 32 days on market |
| Table Mesa (broader) | More typical mid-century tract housing | Down 9-12% depending on window measured, 33-49 days |
| Martin Acres | Boulder's most accessible entry point, smaller ranches | More typical resale pace, priced below neighboring Table Mesa |
If you're weighing neighborhoods against each other, the citywide median is close to useless for that comparison. It tells you where Boulder sits relative to last year in aggregate, not what a specific address is likely to do. The more useful question is structural: can more supply realistically show up near this property, or is it locked in by a historic district boundary, an open space edge, or a 50-year-old building facing demolition review even without a landmark designation.
That question matters differently depending on which side of the transaction you're on. Buyers chasing a scarce, restricted pocket like Mapleton Hill should expect less room to negotiate and should budget real time, not just money, for any exterior work they're hoping to do after closing. Sellers in a more ordinary tract neighborhood, where the current data shows more give, benefit from realistic pricing and patience rather than assuming last year's comps still hold. And for financed purchases, especially VA loans where the appraisal has to support the contract price with no room for a gap, understanding which side of this split a property sits on before you write an offer is worth more than any single headline number.
Does a lower citywide median mean Boulder prices are actually falling? Not evenly. The citywide figure blends neighborhoods with almost no ability to add supply against neighborhoods where turnover and renovation are easier. A flat or slightly negative citywide number can coexist with specific pockets still selling quickly and firmly.
How does this affect a VA or conventional appraisal? Appraisers rely on recent comparable sales in a defined area. In a neighborhood like Mapleton Hill or Chautauqua, where inventory is thin and historic district rules limit what gets built or altered, finding a truly comparable recent sale can take more digging, which is exactly where a well-prepared comp package and an agent who understands the local appraisal terrain earns its keep.
If you're trying to figure out which Boulder pocket actually fits your timeline, your renovation plans, or your financing, that's a conversation worth having before you fall for a listing photo. Terri Gray works across Boulder's neighborhoods every week and can walk you through what a specific address's constraints mean for your offer, your appraisal, and your plans down the road. Reach out to request a free home valuation or a personalized buyer consultation.
Stay up to date on the latest real estate trends.
Let me know how I may be of assistance to you.